
Steps to Begin Evaluating Fidelity Data
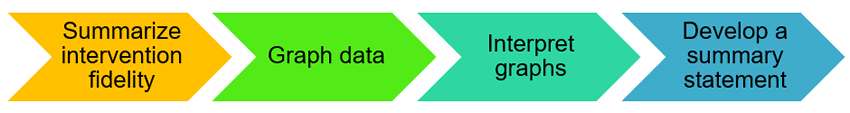
Step 1: Summarize Intervention Fidelity
- What is the percentage of intervention steps implemented as planned during this session?
- What is the extent to which a particular intervention step was implemented over time?
Step 2: Graph Data
- Use a graphing software (e.g., Excel, Google Sheets) to create a visual of the data you collected.
Step 3: Interpret Graphs:
- Trend - is the implementation increasing or decreasing over time or the pattern of change in the data over time.
- Variability - does implementation vary day-to-day, the amount of "bounce" of data.
Step 4: Develop a Summary Statement
- Develop a statement that accounts for the trend, level, and variability of intervention fidelity across time and highlights specific intervention step fidelity.
- Are critical intervention steps being implemented regularly?
- Is the extent of intervention fidelity sufficient for the learner to make adequate progress?
- Make determination - is intervention fidelity sufficient?